Thursday, February 12, 2015

My function

What’s your function?

Part a

1.     I got my article from New York Times, Neil Irwin, Job Growth Looks Great; Wage Growth, Less So, The New York Times. 9 January 2015. Web. 11 February 2015.
As the title suggests, the article talks about the growth in the number of jobs causing, indeed, the unemployment rate to fall. However, that was not a good signal to the wages.  In fact, the average hourly wage has fallen despite the job growth.
2.     A function is a set of ordered pairs in which each x-element has only ONE y-element associated with it. In other words, relations are functions when they have a single output for one or multiple inputs. In this case, the inputs are months and percentage change where each month is associated with its own percentage change.
3.    
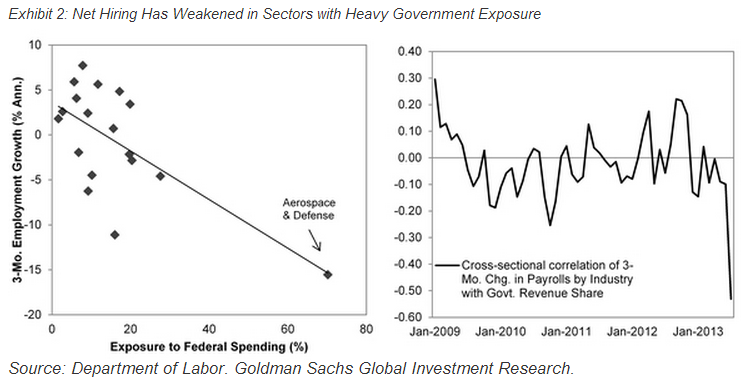
4.     As we can see in this graph, there is a percentage change in function of the years. We can clearly notice that we have been given the changes during the period of each year, the reason why we see fluctuations within a year. As of the time this snapshot was taken, the percent change in average hourly wage was 1.7% compare to January 2014, which was approximately around 2%. Comparing these two data, we know that the wages have fallen around 0.3%.
5.     This function is not linear.
6.     Through the graph, we can clearly see that this function is not linear. In fact, this means that the average of change is not constant. For example, the average rate of change between January 2008 and January 2010 was approximately [(3-1.8)/2 = 0.6] compare to the average rate of change between January 2013 and January 2015 which was [(2.2-1.7)/2 = 0.25]. These two are different, therefore not constant.
7.     Since this function is not linear we cannot write in the form of Y = aX + b where a and b are constants. I am not sure about the notation for this function however since it is a percentage change the rates were calculated beforehand and then plug in the graph or maybe this graph has a direct relationship established by software.

Part B
1.     A relationship that is not a function is when a single input has numerous outputs.  
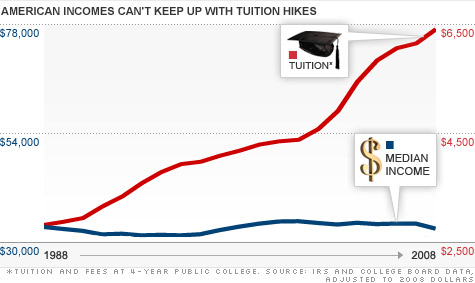
2.     I found my article on New York Times, which is about mortgage subprime and low-income zip codes. (http://www.nytimes.com/2015/02/13/upshot/how-mortgage-fraud-made-the-financial-crisis-worse.html?ref=business&abt=0002&abg=0)
3.     This article shows that the financial crisis was partially caused by the numerous loans made to people living in low-income zip codes which income are relatively low. In other words, they borrowed more than they could afford.

4.     This relationship is not a function because within a zip code can live multiple borrowers with different subprime. Therefore, if we were to graph this we would have different vertical lines along a zip code corresponding to different subprimes (an input with different outputs).

Whats your Function?- Jonathan Murray


A.
  I chose an article on Tom Brady's passing yards over the past couple years. 
A function is a mathematic relationship involving variables. For every input there is only one output. 

3.


The function here is between passing yards and the time. Passing yards are a function of each year. The function is not linear, it rises and fall independently based on Tom Brady. The slope is not constant then, as it varies year to year. This means it's not a mathematical model. This is because the inputs have no effect on the outputs. 

B.


Here is a graph of US housing values. Relationships are not functions when the input has no effect on the output, or there are more than one outputs for one input. Such is here with this graph, as the values of the home are unaffected by the year. This relationship is between property values after 1990, and the year. Since there is no correlation, this cannot be a function. 


What's your function?


What’s Your Function?
Part A

1.     I found an article about the revenue of Kellogg Company.
2.     The relationship for function is one input exactly matches with one output.
3.     Data Above
4.     As the year increases, the revenue of Kellogg Company is not always increases.
5.     It’s not a linear function.
6.     This is not a linear function.
7.     This graph is not a linear function because it doesn’t have the constant rate of change. The rate of change =(Y2-Y1)/(X2-X1), so use (13485.8-14080.8)/(2001-2000)=-595. Then, I use (13567.5-11794.1)/(2003-2002)=1773.4 In this case, the rate of change is different, so it’s not a linear function.
8.     It’s not a mathematical model because the input doesn’t depend on output.

Part B


Part B:

For Part B, I found a chart of Harvard University acceptance-The SAT and ACT scores.

http:www.http://blog.sina.com.cn/s/blog_5f2bdc0e01019z7x.html

1. It's not a function because one input is not exactly matches with one output.

2. Data above

3.From the data above, there are more inputs than outputs, because students have the same SAT and
ACT scores.

4. This is not a function because there are lots of inputs more than outputs.

Wednesday, February 11, 2015

What's Your Function?


1.  I chose an article from the Washington Post about the relationship between income inequality and social security funding.

2.  A function is a relationship in which a single input corresponds to a single output.

Example:
A=>B
"If A, then B" is a function.

A=>B & C
"If A, then both B and C" is not a function

A function can also be identified graphically via the vertical line test.  If the relationship in the graph is a function, the vertical line should only intersect at one point.

Functions are usually displayed mathematically through function notation.  Function notation is represented by the expression  y = f(x) where "f" is the name of the function, "x" is the input value and "y" is the corresponding output value.

3.


4.  This graph displays the relationship between time/years (x-axis) and the % of wages that have escaped social security taxation (y-axis).

5.  The function in the graph above is not linear.

6.  We can be certain of this because it does not have a constant rate of change.  In order for a relationship to be linear, the line depicted would have to be straight.  This is obviously not the case.

7.  N/A

8.  The graph is, however, a mathematical model.  A mathematical model is a special type of function in which the output (y-axis) depends on the input (x-axis).  It can be represented as y = f(x), where "x" is years and "y" is the percentage of escaped wages.  It is clear that it cannot be the other way around, because wages do not affect time.

Part B

1.  Recall that a function cannot have more than one output per input.

2.  Huffington Post Article

2013-09-12-seq_inds.png

3.  The display on the left shows the relationship between exposure to federal spending (x-axis) and employment growth within various industries (y-axis).  In function notation this could be represented by the expression y = L(x).  In other words, for "x" amount of federal spending, there is a certain level of employment growth defined as "y". This relationship is laid out on what is referred to as a scatter plot.

4.  Simply by looking at the scatter plot we can see that it does not pass the vertical line test.  It is therefore not a function because there are multiple outputs for a single input.

What's Your Function?


What's Your Function?

Part A:

1. I found an article about the sales of Coca Cola Company
2. The relationship for function is when each input has one output
3. The data above
4. It shows that as the year increases the revenue of the Coca Cola Company also increases
5. This is not a linear function
6. -
7. This is because it doesn't have the constant rate of change. If we find the change of 2009 -2010 and 2011-2010, the change will not be the same.
8. It's not a mathematical model because the input doesn't depend on output

Part B

For part B I found a chart of Princeton's acceptance- the GPA, SAT and ACT scores
http://collegeapps.about.com/od/GPA-SAT-ACT-Graphs/ss/princeton-admission-gpa-sat-act.htm
1. Relationships that are not functions is when inputs have many outputs
2.

3. From the graph there are more inputs for one output ( There are many students who has the same score of SAT/ACT scores and GPA
4. This is not a function because there are multiple outputs for one input

What's Your Function? Blog Post #2 by Youwei Cheng (Ben)

Part a:
1.I found an GDP of China 
2. From the data it shows, I think this relationship
3.
Year, t
2007
2008200920102011201220132014


GDP(G)
2.4
3.2
4.0
2.6
3.8
2.7
3.4
4.5


4. This is the data of GDP of China from 2007-2014. T, represents the year, T=2007 means in 2007. The GDP is the function of year. So, it can be represent in function notation as G=f(t).
5.R.O.C1=0.8         R.O.C2= 0.8      R.O.C3==-1.4
7. This function is not a linear function,because the rate of change is not constant.
8. NO, it is not a mathematical model, because the output is not depend on the input
Part b:
1.The Data of GDP of China and Japan. The data of GDP of China and Japan is not a function.
2.
Year, t
2007
2008
2009
2010
2011
2012
2013
2014


GDP of China 
2.4
3.2
4.0
2.6
3.8
2.7
3.4
4.5


GDP of Japan
1.7
1.8
2.9
3.0
3.2
3.1
2.9
2.9


3.This is the GDP  between two country,  T represents the year, t=2007 means in 2007, and in that year,China's GDP is 2.4 and the GDP of Japan is 1.7.
4. data of GDP of China is not a function of data of GDP of China.  Because exactly one output is not paired with exactly input.

Tuesday, February 10, 2015

What's Your Function? Blog Post #2


Part a)

I chose an article that analyzes the rising cost of college tuition from 1998 to 2008, and although the graph has two values, the median income over those 20 years and the rising tuition cost over the 20 years, I'm using the tuition cost as my function. The function that is represented here is the price of tuition per year over a 20 year period. Ultimately, this relationship shows that for every increasing year, tuition increased. Therefore, this is a linear function because for every inout there is a different output. the average rate of change is 2400 which means that the tuition is greatly increasing. This is a mathematical model because the outputs(price of tuition per year) are dependent upon the inputs(year).

As portrayed on the left axis, median income has hovered around $33,000 since 1988. Meanwhile, college tuition and fees -- portrayed on the right axis -- have more than doubled.
Part b)

A study I found by the Chicago Tribune analyzes the idea that weight affects the amount of income you make. However, while this can not technically be proved or disproved, it is not a function because for example, 5 people who all weighed 150 pounds made different incomes. This means that your body weight and stature does not dictate how much money you make because while these 5 people were of the same weight, they were of different height which means their bodies were all different. Ultimately, this is not a function because the output, total income, had more than one input per weight.

Monday, February 9, 2015

What's Your Function

Part A

1. I searched the Economist (magazine) website for articles
2. A function is a function when one input is paired with exactly one and only one output, and its graph passes the vertical line test.
3. The graph I selected that demonstrates a function comes from an article called "Musical Chairs" about British Unemployment. For the sake of this assignment, I will only be looking at Percent Unemployed related to the Year (red line).

4. The graph represents the Civilian unemployment rate in each quarter (3 months) of each year in Britain from 2005-2014. Q1 stands for Quarter 1, Q3 for Quarter 3, and so on. 
5. The relationship is not linear. 
6. n/a 
7. Between each quarter, there are several variations in rates of change. for example, the original unemployment rate in Q1 of 2005 was roughly 4.75%. In Q3 of 2014, it was roughly 6%. Therefore, the rate of change was 2% over 9 years and 2 quarters, or 9.5 years. Therefore, the average rate of change is 0.2/9.5 or 0.021. This is a much smaller rate of change than that of Q1 of 2008 to Q3 of 2009, where the unemployment rate increases almost 3% in just 1.5 years, with a rate of change of 0.2(0.3/1.5). We know this is not a linear function because the Average Rate of Change is not equal to any rate of change between two given points on the graph. 
8. Yes, this is a mathematical model, although it is debatable amongst Economists. Most, however, would agree that the unemployment rate is a function of time, because as economic conditions improve or worsen, the market fluctuates and more or less people become employed. 

Part B


This graph represents the relationship between height and wealth in the Netherlands over time. The graph shows that over time, as wealth grows, people also have become taller in the Netherlands. This is perhaps suggesting that as a society develops and earns more money, its people become healthier and grow faster and taller.  It is not a function because income was the same in years at the beginning of the graph, as well as somewhere between 1918 and 1940. It is also quite likely that income was the same in 1870 as 1918. This graph therefore has multiple outputs per input, and is not a function. 


What's Your Function?


PART A
1. I found my article on the Department of Labor's website. I simply searched for the unemployment rate. 
     In summary, this is a graph conducted by the United States Department of Labor in order to show the unemployment rate over a given period. 

2. Functions can occur in many ways. One way you can distinguish whether or not something is a function is to understand that it only occurs when one input is assigned exactly one output. Another way you could tell whether or not something is a function is by looking a the graph. If the graph passes the vertical line test, then there is a function. 

3. 
4. This function represents the relationship between time and the percent of people unemployed in the during the month of January from 2005 to 2015. 

5. This graph does not represent a linear function because it is not a straight line. Furthermore, this graph does not have a constant rate of change at every interval. We know this by referring to the graph. On January 2007, the unemployment rate was approximately 5%. On January 2010, the Unemployment rate is was about 10%. Then, on January 2014, the unemployment rate dropped to about 7%. The constant changes in the rate of change do not allow the line to be straight and thus, not creating a linear function. 
6. This function is not a mathematical model because the percent of the unemployment rate (output) does not depend on time (input). ( The unemployment percentage actually depends on the economy)
Percent = f(time)

PART B


This graph is not a function. It is not a function because you can have two outputs for one input. For example, you can have a set of people with an average income of $50000 who have 40% chance of voting for Romney, but you could also have another group of people with an average of $50000 who have a 60% of voting for Romney. this will not allow the graph to pass the vertical line test, which is another reason as to why it would not be a function. 

What's Your Function- blake keats

Part a:

2.     A relationship is considered a function when there is exactly one output paired with exactly one input and if it passes the vertical line test.
3.     A relationship in this periodical was the increase in amount of stores that Michael Kors opened and their quarterly earnings. In 2011 there were 231 stores and in 2014 there were 703 stores.
4.     This relationship shows a general negative correlation because as the amount of open stores is increasing, the quarterly earnings are slightly decreasing.
5.     No this is not a linear function.
6.     N/A
7.     The average rate of change does not stay constant.
8.     This is not a mathematical model because the growth or decline of earnings is not a function of the quarter of fiscal growth.

Part b:

1.     A relationship is not a function if there are multiple inputs per single output and if it does not pass the vertical line test.
3.     This relationship is explaining the amount of measles cases each year since 2001.

4.     This relationship is not a function because the graph shows that there are multiple outputs for