Professor Little
Applied PreCalculus
20 April 2015
Blog 4: Be the Professor, Transformations
Hello everyone!
Today, I will be discussing transformations, a topic that is broad, because it can apply to essentially any type of graph!
The graphs we have covered the most, previously, have been linear functions and quadratic functions, so I will explain transformations for each of these in this lesson:
To start, I will define a transformation as the adjusting of a graph, usually through vertical and/or horizontal shifts, and stretches and/or compressions.
First, linear functions. The parent function for linear graphs is as follows: y = x. By parent, I mean that the graph appears as a straight line that passes straight through point (0,0) and has a slope (or consistent rate of increase) of 1. Since a linear function is a straight line, the only possible transformations are vertical and horizontal shifts. The parent function of linear functions is displayed below:

To shift a linear function vertically, add or subtract the number of shifts from "x." For example, to shift a linear function two spaces up, the new function would read "y = x + 2." To shift down, subtract the number, or "y = x - 2." Horizontal shifting is slightly more complicated. I like to think of horizontal shifting as the "opposite shift." When shifting to the right, instead of adding, which would seem most logical because you are moving in the positive range of numbers, instead you subtract the value. For example, to shift two spaces to the right, the new function would read "y = (x - 2)". When shifting to the left, think the same way. I.e. "y = (x + 2)". When writing functions with horizontal shifts, be sure to include the added value in parenthesis, because otherwise, the shift is documented as vertical (i.e. y = x + 2 is different from y = (x+2) ).
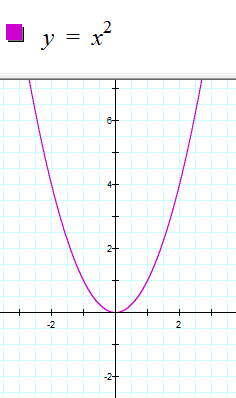
Second, to quadratic functions. The parent function for quadratic graphs is y = x^2, which forms a parabola shape, displayed below:
For vertical and horizontal shifts, the formula is very similar to that of linear functions: To move up/down, add or subtract a value from the x^2, outside of parenthesis. To move right or left, subtract or add, respectively, and inside of parenthesis. However, since the parabola is not straight, we can also horizontally stretch and compress the graph. To stretch a parabola, multiply the function by a value that is greater than zero, but less than 1 (or 0<x<1). For example, if the parent function is multiplied by 1/3, which's graph would read y = 3x^2, then the graph would be three times as wide as the original. To compress the graph by 3, however, multiply the function by 3. Similar to horizontal shifting, compression might seem a bit contradictory, since the larger the number, the more it is compressed, so be sure to remember this when writing functions with stretches, and compressions.
A parabola can also be reflected about the x axis. To do this, you must simply multiply the entire function by -1. For example, to reflect the parent function, y = x^2, about the x axis, the new function would read y = -(x)^2.
So, how to apply these concepts to the real world? In terms of linear functions, imagine that you are projecting growth of sales income for a new company. If your company began with a budget of $200, then the graph would not begin at zero, but at 200 (which you may represent by "2"). In that case, you would need to properly shift the graph up by 2 units so that it properly represents how your sales income began.
Parabola transformations can be applied in a similar way. If you are trying to predict the path of a ball, for example, and the person throwing the ball is not standing on flat land, but raised, the parabolic shape will need to be shifted up to correctly represent the path of the ball, and give a better projection of the ball's path.
A broad understanding of transformations will always be helpful when plotting information, shapes, or models of actions so as to better predict growth, and actions that surround us. Try to pay attention to linear and parabolic shapes the next time you are playing a ball game, or reading through statistical info in a newspaper!
Photographs:
Linear:
http://www.jleemack.com/uploads/6/7/9/7/6797819/4025486.jpg
Parabolas: http://jwilson.coe.uga.edu/EMAT6680Su12/Jackson/Writeup02DMJ/Assignment%202%20Problem%204%20Parent%20Function.PNG
I like your usage of graphs! you use very visual language that helps assist in the understanding of the concept
ReplyDeleteI like the way you teaching! Every step is clear and easy to understand. Your graphs are perfect also. I love it !
ReplyDeleteYour real world application questions made the lesson more interesting, and you did a great job of going really in depth with your explanations. Good job!
ReplyDeletechanning,
ReplyDeletei like your lesson. you did a really nice job with your real world example involving projection growth. your explanations for vertical and horizontal stretching and compressing are good, but i think it would have added a little bit more clarity to see the transformations visually...actually showing the stretches and compressions on a graph. otherwise, good job. =]
professor little