Part a)
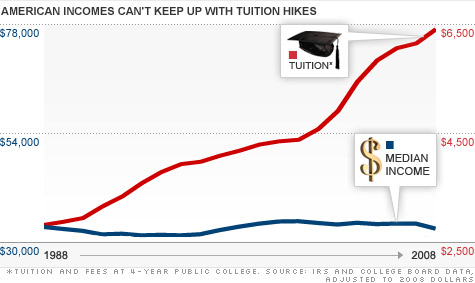
I chose an article that analyzes the rising cost of college tuition from 1998 to 2008, and although the graph has two values, the median income over those 20 years and the rising tuition cost over the 20 years, I'm using the tuition cost as my function. The function that is represented here is the price of tuition per year over a 20 year period. Ultimately, this relationship shows that for every increasing year, tuition increased. Therefore, this is a linear function because for every inout there is a different output. the average rate of change is 2400 which means that the tuition is greatly increasing. This is a mathematical model because the outputs(price of tuition per year) are dependent upon the inputs(year).
Part b)
A study I found by the Chicago Tribune analyzes the idea that weight affects the amount of income you make. However, while this can not technically be proved or disproved, it is not a function because for example, 5 people who all weighed 150 pounds made different incomes. This means that your body weight and stature does not dictate how much money you make because while these 5 people were of the same weight, they were of different height which means their bodies were all different. Ultimately, this is not a function because the output, total income, had more than one input per weight.
Great Explanation!
ReplyDeleteit is interesting.
ReplyDeleteI like that you chose a topic that is current for part a. I also liked that you included that graph, however, i would've liked to see more data on the graph, such as low and high income families and whats the gap between them
ReplyDeleteanna,
ReplyDeletegreat article selection. your first graph is easy to read and you explained most parts correctly. the relationship is a "function" because for every output there is exactly one input, but it is not a linear function. there is no constant rate of change. you are correct that it is a mathematical model.
your second example is good, but you should have included a graph or table of some sort to confirm this relationship.
professor little