1. I chose an article from the Washington Post about the relationship between income inequality and social security funding.
2. A function is a relationship in which a single input corresponds to a single output.
Example:
A=>B
"If A, then B" is a function.
A=>B & C
"If A, then both B and C" is not a function
A function can also be identified graphically via the vertical line test. If the relationship in the graph is a function, the vertical line should only intersect at one point.
Functions are usually displayed mathematically through function notation. Function notation is represented by the expression y = f(x) where "f" is the name of the function, "x" is the input value and "y" is the corresponding output value.
3.

4. This graph displays the relationship between time/years (x-axis) and the % of wages that have escaped social security taxation (y-axis).
5. The function in the graph above is not linear.
6. We can be certain of this because it does not have a constant rate of change. In order for a relationship to be linear, the line depicted would have to be straight. This is obviously not the case.
7. N/A
8. The graph is, however, a mathematical model. A mathematical model is a special type of function in which the output (y-axis) depends on the input (x-axis). It can be represented as y = f(x), where "x" is years and "y" is the percentage of escaped wages. It is clear that it cannot be the other way around, because wages do not affect time.
Part B
1. Recall that a function cannot have more than one output per input.
2. Huffington Post Article
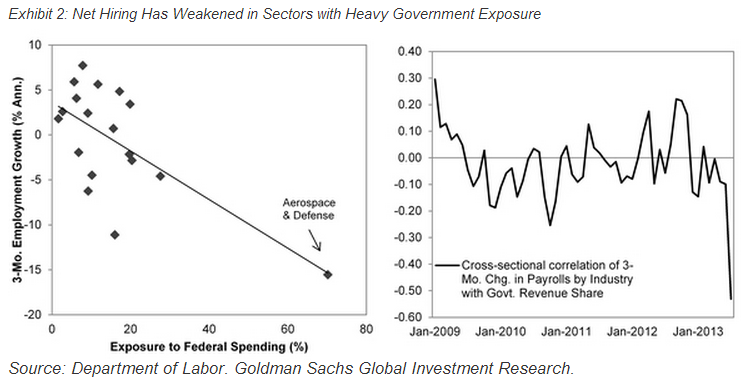
3. The display on the left shows the relationship between exposure to federal spending (x-axis) and employment growth within various industries (y-axis). In function notation this could be represented by the expression y = L(x). In other words, for "x" amount of federal spending, there is a certain level of employment growth defined as "y". This relationship is laid out on what is referred to as a scatter plot.
4. Simply by looking at the scatter plot we can see that it does not pass the vertical line test. It is therefore not a function because there are multiple outputs for a single input.
Will,
ReplyDeleteGreat graphs! I was able to visually see what you were writing about!
-Tyler
Will I do not think that using the vertical line test for the scatter plot is good. The points look to have different outputs for the same input.
ReplyDeleteI like how thorough your explanations of the data and graphs were, it made them easy to interpret and understand!
ReplyDeletewill,
ReplyDeleteyour first example is good and interesting and you explained most parts well. the wording for how you defined a function is generally that we have one output per input and not visa versa. also, i think it can be argued that the escaped wages doesn't depend on time. if there was an increase every year, then maybe, but there are some years where it drops.
your second graph using the scatter plot is a good example of a non function, for sure.
professor little
will,
ReplyDeletethis post was one day late so it will lose one point.
professor little